Classic divergence
Price made a new high, the indicator did not. The move is going on with less strength behind it.
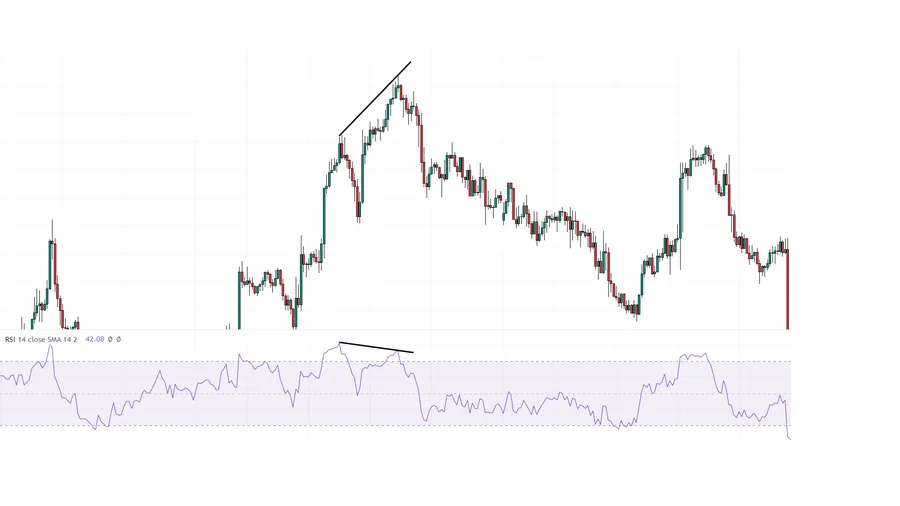
Classic divergence — what it is?
Regular divergence is a disagreement between price and the indicator at the extremes. Price makes a new high while RSI makes a lower high: the rally continues, but there is less strength in it.
The mirror image at the lows: price makes a new low, the indicator does not. Sellers pushed price down, but with less effort than the time before.
This is a signal of a weakening impulse, not a signal of reversal. Structure confirms the reversal; divergence only shows where to look for it.
Classic divergence — how it is built?
You compare two adjacent significant extremes on one timeframe. Divergence carries the most weight on the third new extreme: by then liquidity has been collected and there is no strength left to continue.
Classic divergence — common mistakes
Entering on divergence without a CHoCH. In a trend it can hold for a very long time.
Comparing non-adjacent extremes, picking whichever pair is convenient.
Hunting for divergences on M5 and below.
Treating it as a signal in itself rather than a filter for other signals.
Related to
Glossary
- divergence
- price and the indicator pointing in different directions.
- indicator
- a calculation based on price or volume, drawn on the chart.
- high
- the highest price of the period.
- relative strength index
- an oscillator from 0 to 100 showing the balance between the strength of rises and falls.
- lower high
- a high below the previous one.
- low
- the lowest price of the period.