Hidden divergence
The reverse picture: price pulled back less than the indicator. A sign that the trend will continue.
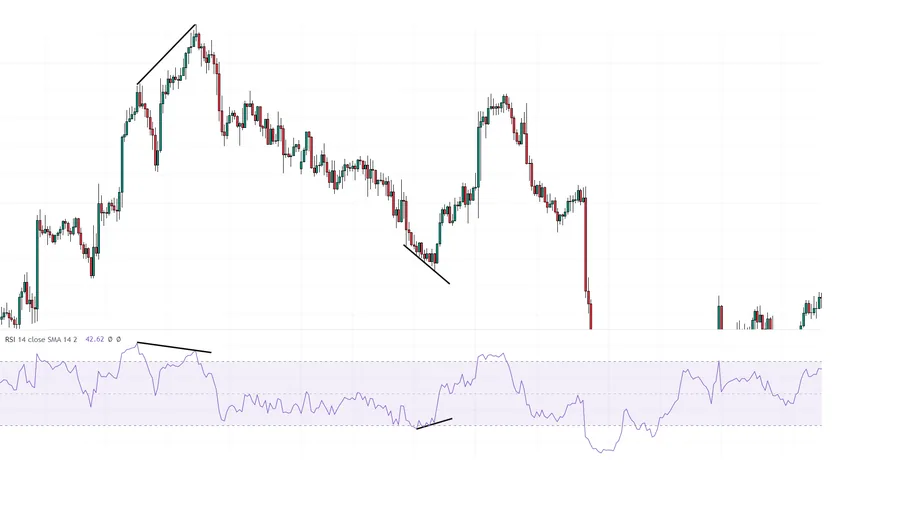
Hidden divergence — what it is?
Hidden divergence works the other way round: the indicator makes the new extreme, price does not. In an uptrend price makes a higher low while RSI makes a lower one.
It reads as a sign of continuation, not reversal. The correction was deep by the indicator, but price held the structure.
The practical use is confirming an entry with the trend: if the zone lines up with hidden divergence, that is an extra argument for continuation.
Hidden divergence — how it is built?
You compare the lows in an upward move and the highs in a downward one. The mandatory condition is that trend structure is intact: hidden divergence outside a trend means nothing.
Hidden divergence — common mistakes
Confusing it with regular divergence: there price makes the new extreme, here the indicator does.
Using it in a range, where there is no trend to continue.
Treating it as a standalone entry signal.
Using it after structure has already broken.
Related to
Glossary
- indicator
- a calculation based on price or volume, drawn on the chart.
- uptrend
- a sequence of higher highs and higher lows.
- higher low
- a low above the previous one.
- relative strength index
- an oscillator from 0 to 100 showing the balance between the strength of rises and falls.
- trend
- a steady directional move in price.
- divergence
- price and the indicator pointing in different directions.