Hammer
A candle with a long wick down: price was pressed lower but bought back. It appears at the bottom of a move.
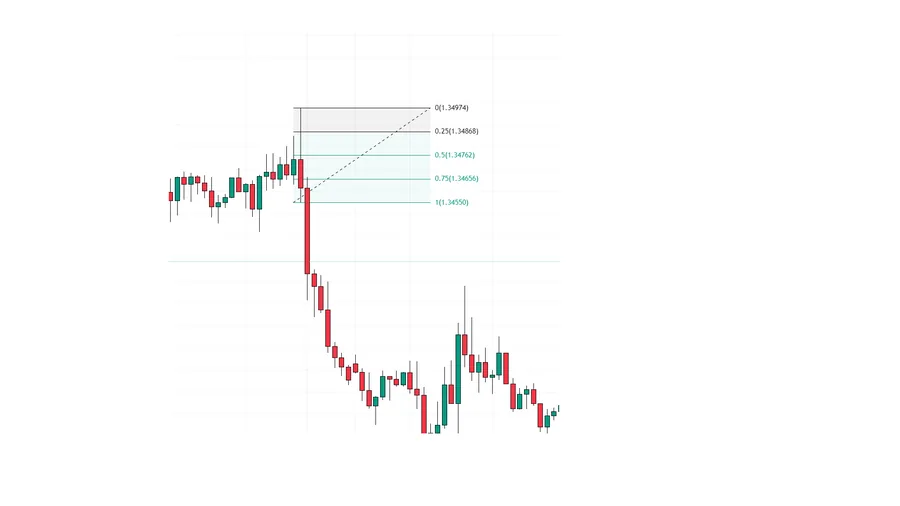
Hammer — what it is?
A hammer is a candle with a small body at the top and a long lower wick. The wick has to be noticeably longer than the body, and there's almost no upper wick.
It reads like this: over the period price was pushed down, but by the close it was bought back. Sellers tried to press it through and couldn't hold the result.
The pattern on its own decides nothing. It gains meaning when the hammer forms inside a marked zone and its lower wick has taken liquidity below the previous low.
Hammer — how it is built?
A reference point: the lower wick at least twice the body, the upper wick minimal. The location matters: a hammer in empty space is just a candle, a hammer in a demand zone after a liquidity grab is confirmation for an entry.
Hammer — common mistakes
Entering off a hammer with no reference to a zone or to structure.
Confusing a hammer with a hanging man: the shape is the same, the only difference is where the candle appeared.
Treating a long wick as weakness. A wick is the footprint of liquidity being taken, the most meaningful part of the candle.
Taking a hammer on a lower timeframe while ignoring the direction of the higher one.
Related to
Glossary
- candle
- the element of the chart that shows four prices for a period: open, high, low, close.
- candle body
- the rectangle between the open and the close.
- long
- buying in expectation of a rise.
- wick
- the thin lines above and below the body that show the high and the low of the period.
- close
- the last price of the period. Considered the most important of the four: breakouts are confirmed by the close.
- liquidity
- a cluster of pending orders and stops in a particular zone. The fuel for large capital to move.
Test yourself
Which chart has a hammer — a long lower wick?
Correct. The app has tasks like this in every lesson — 119 lessons on real charts. Solve in the app →
Not this one. The right answer is the other chart. The app has tasks like this in every lesson — 119 lessons on real charts. Solve in the app →