Supply and demand zones
Not a line but a band the strong move started from. Price returns there for the volume left behind.
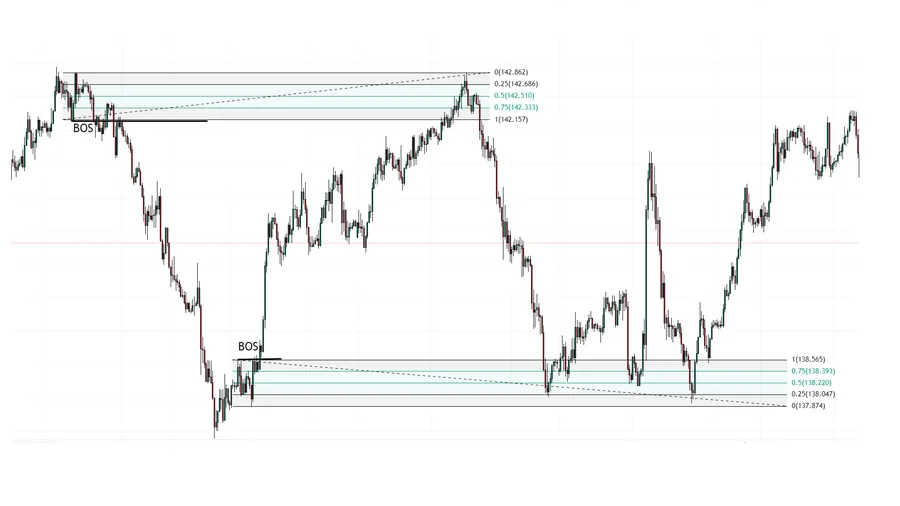
Supply and demand zones — what it is?
A demand zone is the area price left upwards with impulse. A supply zone is the area it left downwards. In essence these are places where large volume entered the market.
They differ from an order block in that you take not a single candle but the whole consolidation area before the impulse. Often that is several candles in a row with a narrow range.
The logic of the return is the same: part of the volume was left unfilled, and when price comes back to the zone there is a reaction again.
Supply and demand zones — how it is built?
The boundaries are set by the full range of the candles in the area, wicks included. Then the quartile grid. The quality of the zone is judged by the force of the exit from it: the sharper price left, the more weight the zone carries.
Supply and demand zones — common mistakes
Marking the zone by candle bodies and losing the wicks.
Taking a zone with no impulsive exit: without it, it is just a patch of chart.
Reusing a zone after it has been worked off.
Ignoring structure: a zone against the higher-timeframe direction works worse.
Related to
Glossary
- demand zone
- an area where buyers previously showed strength.
- impulse
- a fast directional move with large candles.
- supply zone
- an area where the sellers showed strength.
- volume
- the number of trades or contracts in a period.
- Order block
- the last candle in the opposite direction before the impulse that broke structure.
- candle
- the element of the chart that shows four prices for a period: open, high, low, close.