Stop-loss liquidity
Your stop is somebody else's matching order. Placed in an obvious spot, it becomes a target.
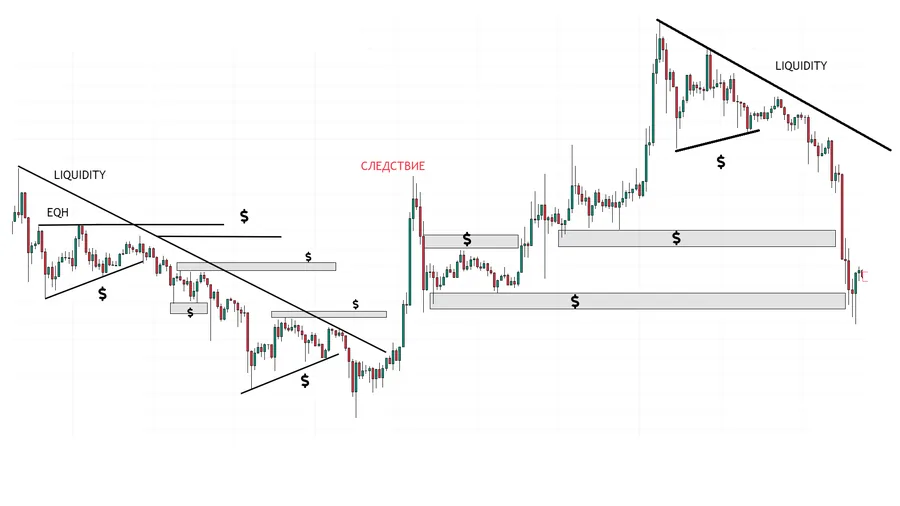
Stop-loss liquidity — what it is?
Stop-loss liquidity is the cluster of retail traders' protective orders. The most predictable kind of liquidity, because the rules for placing them are known to everyone and identical.
The textbooks say to put your stop beyond the level, beyond the candle extreme, beyond the neckline of the pattern, beyond the channel boundary. And that is exactly what everyone does.
As a result the map of stops matches the map of classical technical analysis. That is precisely why you need to know it — not to trade by it, but to see where the fuel for a move is lying.
Stop-loss liquidity — how it is built?
Mark the places the textbook tells you to put a stop: beyond equal highs, beyond the extreme of the last swing, beyond pattern and channel boundaries. Put your own stop somewhere else — beyond the zone, with a buffer.
Stop-loss liquidity — common mistakes
Putting your stop in the obvious place and being surprised it gets taken out.
Taking a stop run personally: the mechanics are impersonal.
Marking stops where there is no obvious geometry.
Removing the stop altogether so it cannot be swept. That trades a limited loss for an unlimited one.
Related to
Glossary
- stop-loss
- an exit level set in advance for a losing trade.
- liquidity
- a cluster of pending orders and stops in a particular zone. The fuel for large capital to move.
- candle
- the element of the chart that shows four prices for a period: open, high, low, close.
- channel
- two parallel lines that bound the move above and below.
- equal highs
- two or more highs at the same level. Orders pile up under and above them.
- swing
- a local extreme, the point where a move turns.
Test yourself
Where was liquidity taken from above and price came back?
Correct. The app has tasks like this in every lesson — 119 lessons on real charts. Solve in the app →
Not this one. The right answer is the other chart. The app has tasks like this in every lesson — 119 lessons on real charts. Solve in the app →