Trendlines
A line along the trend: connect the lows in a rise or the highs in a fall and watch whether the slope holds.
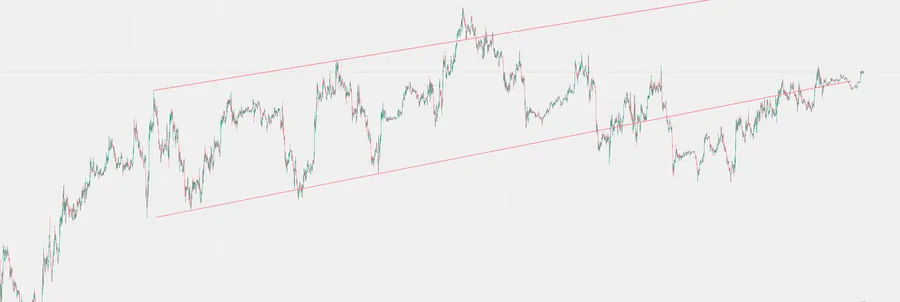
Trendlines — what it is?
A trendline is drawn through two consecutive lows in an upward move, or two consecutive highs in a downward one. The third touch counts as confirmation.
The problem is exactly the same as with horizontal levels: everyone sees the line. In an upward move buyers' stops pile up beneath it, and that makes it a target rather than a defence.
The practical value of the line isn't that price bounces off it, but that it shows you where the crowd will place their stops and where the market will take liquidity from.
Trendlines — how it is built?
Draw it on the extremes, wicks included. A sloped line is less reliable than a horizontal level: it can be drawn a dozen ways, and every trader will draw it their own way.
Trendlines — common mistakes
Adjusting the slope to fit the picture you want until the line "works".
Trading the bounce off the third touch. That's most often where the sweep happens.
Treating a break of the line as a reversal. Breaking a sloped line is a weak signal without confirmation from structure.
Drawing on bodies and losing the extremes, which is where the liquidity sits.
Related to
Glossary
Test yourself
Where is a pullback inside the trend, not a reversal?
Correct. The app has tasks like this in every lesson — 119 lessons on real charts. Solve in the app →
Not this one. The right answer is the other chart. The app has tasks like this in every lesson — 119 lessons on real charts. Solve in the app →