The trend and its types
A trend is price making new highs, or new lows, again and again in one direction.
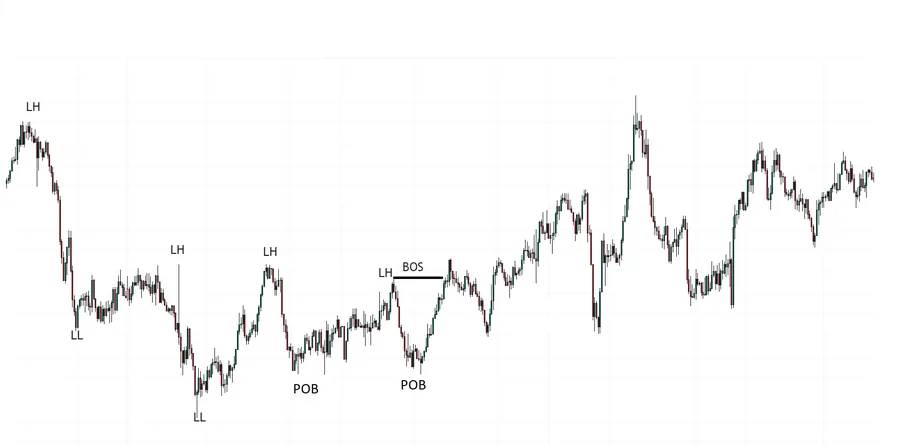
The trend and its types — what it is?
A trend is not the slope of a line and not a feeling. It's a sequence of extremes: an uptrend is every high above the previous one and every low above the previous one, a downtrend is the mirror image.
As long as the sequence holds, the trend counts as active, however drawn-out the pullback looks. The moment the next low prints below the previous one, the ascending sequence is broken — and that's the signal.
The third state is a range, where highs and lows sit at roughly the same level. That's not "no trend", it's a separate phase with its own rules.
The trend and its types — how it is built?
Read the trend from the last two pairs of extremes on your working timeframe, not from the whole visible chart. Direction is set on the higher timeframe and isn't revised because of a move inside the lower one.
The trend and its types — common mistakes
Judging trend by eye from the slope. Slope is deceptive, the sequence of extremes isn't.
Calling a deep pullback a reversal before the sequence is broken.
Trading against the higher timeframe's direction on the strength of a move inside the lower one.
Looking for a trend where there's a range, and the other way round.
Related to
Glossary
Test yourself
Which chart shows an uptrend?
Correct. The app has tasks like this in every lesson — 119 lessons on real charts. Solve in the app →
Not this one. The right answer is the other chart. The app has tasks like this in every lesson — 119 lessons on real charts. Solve in the app →