Head and shoulders
Three peaks, the middle one higher than the outer two. The classic sign that the rally is over.
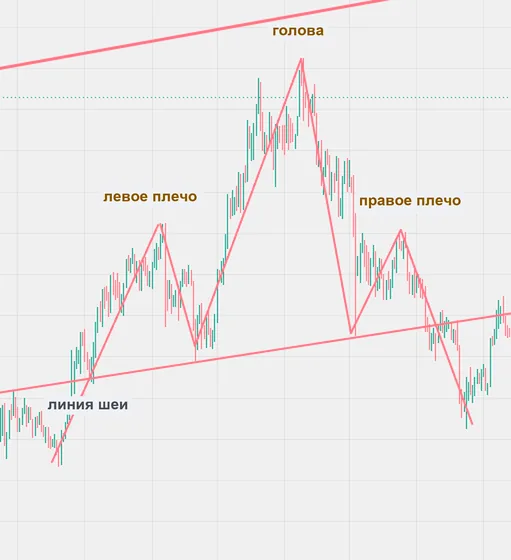
Head and shoulders — what it is?
Head and shoulders is three peaks in a row where the middle one is higher than the other two. The lows between them are joined by the neckline. Classic analysis calls it a reversal pattern: a break of the neckline is a sell signal.
This is the most recognisable pattern in technical analysis, and that is its defining feature. Everyone sees it, everyone sells the neckline break, and everyone puts stops above the right shoulder.
Which means there is a ready-made pool of liquidity above the right shoulder and above the head. Price often goes there first — takes out the sellers' stops — and only then starts to fall.
Head and shoulders — how it is built?
The neckline is drawn across the lows between the peaks, wicks included. The practical value of the pattern is not the signal but the map: you know where the crowd will enter and where its stops will sit.
Head and shoulders — common mistakes
Selling the neckline break along with everyone else.
Finding the pattern where there isn't one: any three swings can be mistaken for shoulders.
Ignoring the higher timeframe structure for the sake of a pretty pattern.
Placing the stop above the right shoulder — in the most obvious spot.
Related to
Glossary
Test yourself
Which chart shows a double top?
Correct. The app has tasks like this in every lesson — 119 lessons on real charts. Solve in the app →
Not this one. The right answer is the other chart. The app has tasks like this in every lesson — 119 lessons on real charts. Solve in the app →