How to read a price chart as a beginner
In short: Start with Japanese candlesticks: each shows the open, close, high and low for a period. Then look at the sequence of highs and lows — it shows the trend — and at the levels where price reversed before.
Three steps
First, find the trend on the higher timeframe (H4): are highs and lows rising. Second, mark key levels and equal highs or lows with stops behind them. Third, on the working timeframe (H1, M15), wait for price to react at those places.
A typical mistake
Cluttering the chart with a dozen indicators and lines. A clean chart with candles, two or three levels and the structure marked reads better.
A worked example
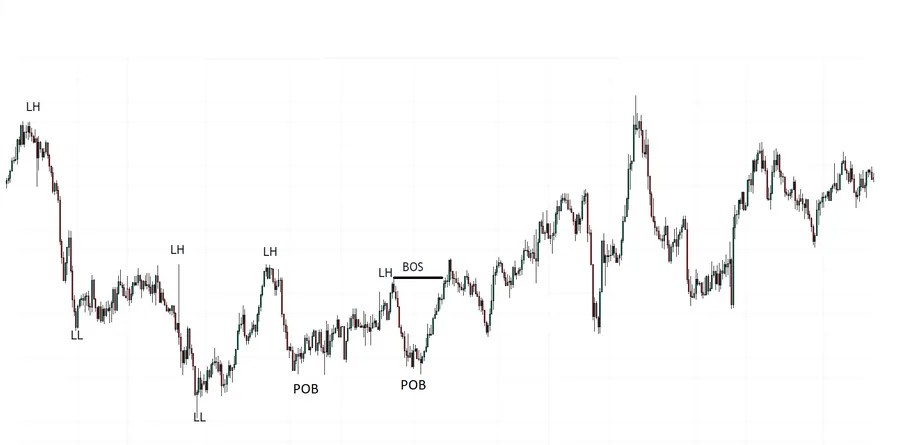
You look at the hourly BTC chart. Step 1 — direction: recent highs are above the previous ones, and so are the lows — an uptrend. Step 2 — key places: the last low the rise started from and the high that has not been broken yet. Step 3 — what next: if price closes above the high, that is continuation (BOS); if it closes below the last low, it is the first sign of a reversal (CHoCH). You are not guessing — you know what each outcome will mean.
How to train your eye
Every day open the same instrument and in 5 minutes mark the trend and the last important high and low. The next day check what happened. Within a month you will start noticing recurring scenarios. "Two charts — one answer" exercises speed this up: you compare similar pictures and learn to see the difference.
Common mistakes
Looking only at the minute chart and missing the big picture. Drawing twenty lines until the chart is unreadable. Counting a wick through a level as a break: a break counts only when a candle closes beyond the level. Deciding where price will go instead of deciding what you will do in each case.
What a single candle shows
Each candle is a slice of time: a minute, an hour or a day. It has four prices: open, close, high and low. The body runs between the open and the close: green (or white) if price rose, red (or black) if it fell. The wicks — thin lines above and below — show where price reached but could not hold. A long lower wick says sellers pushed price down and buyers bought it back. One candle means little on its own: meaning comes from context — where it sits on the chart and what came before it.
Timeframes: from the top down
The same market looks different on different timeframes: chaos on the 1-minute chart, a smooth trend on the daily. Read the chart from the top down. The 4-hour or daily chart shows the direction and the main zones. The 1-hour chart shows where price is now relative to those zones and whether there is a signal. The 15-minute chart is needed only to fine-tune the entry. Two timeframes are enough for a beginner: H4 for direction and H1 for the decision.
Trend, range and reversal
An uptrend is a series of ever higher highs and lows; a downtrend, of ever lower ones. In a range, price moves between two boundaries without making a new high or a new low. Trend continuation is confirmed by a BOS — in an uptrend, a close above the last high. The first sign of a reversal is a CHoCH: a close below the low from which the last high was made. Important: both BOS and CHoCH count only on a candle close, not on a wick piercing the level.
Support and resistance levels
A level is a place where price turned before. Draw not a thin line but a zone: by the full range of the candles, wicks included. The more times price has reacted to a zone and the higher the timeframe, the more significant it is. Broken resistance often becomes support when price comes back to it — this is called a retest. Don't draw twenty levels: the chart should keep two or three nearby levels that truly matter for the decision.
Liquidity: what large players see
Sellers' stops sit above obvious highs and buyers' stops below lows. There are especially many above equal highs and below equal lows. Price often goes to these clusters first, triggers the stops and only then reverses. That is why entering "right off the level" gets stopped out so often: you put your stop where everyone else does. An experienced trader waits until liquidity is taken and enters after the return.
Do you need indicators and volume
Indicators are a recalculation of the same price, and they always lag a little. They can help as a filter (for example, taking buys only above a moving average), but they do not replace reading the chart. More than two indicators on a chart usually just get in the way. Many traders, including those using the Smart Money approach, work with a clean chart: structure, levels, liquidity. At the start it is better to learn to read price without hints and add indicators later, if you really need them.
Checklist: a chart in 5 minutes
1) H4: is the trend up, down or sideways? 2) Where are the nearest strong zones above and below? 3) Where is the obvious liquidity — equal highs and lows? 4) H1: what is price doing right now — heading to a zone, taking liquidity, breaking structure? 5) Is there a setup from my plan? If not, I close the chart. Five questions, five minutes, and a decision made without emotion.
How to read a chart on your phone
On a small screen it is easy to lose context, so always start from a zoomed-out view: zoom out until you see 100–150 candles. Mark zones on the higher timeframe — they stay when you switch. Don't draw many lines: on a phone they merge. And never decide to enter based on one candle on the 1-minute chart — that is the shortest road to an impulsive trade.
Test yourself
First question: a candle opened at 100, closed at 98, high 101, low 95 — what colour is it and which wick is longer? Red; the lower wick is longer (98 − 95 = 3 versus 101 − 100 = 1). Second: in an uptrend, price closed above the last high — is that BOS or CHoCH? BOS. Third: is a zone drawn by bodies or by wicks? By the full range, wicks included. "Two charts — one answer" exercises on real charts are in every Extremum lesson.
How to tell you have learned to read charts
Open an unfamiliar chart and within five minutes write down: what the trend is on the higher timeframe, where the two nearest zones are, where the obvious liquidity is, and what a close above or below the nearest level would mean. A day later, compare with what actually happened. If your scenarios regularly describe the real move — even without guessing the direction — you have the skill. The goal is not to predict but to know in advance what you will do in each case.
Candlestick patterns: should you memorise them
Names like "hammer", "engulfing" or "doji" are worth knowing, but there is no point memorising them as signals. The same pattern at an important zone after a liquidity sweep means a lot, and in the middle of a range almost nothing. Read a pattern as a hint about who is stronger right now, and only together with context: trend, zone, liquidity.
FAQ
Where do I start learning to read charts?
With candles and timeframes, then trend and range, levels and market structure. Back each idea with exercises on real charts, not just reading.
What do green and red candles mean?
Green: price rose over the period, so the close is above the open. Red: it fell. The colours can be changed, but the point is the same: the body shows where price went over the period.
Which timeframe should a beginner choose?
The 4-hour for direction and the 1-hour for the decision. A beginner is better off leaving 1-minute charts alone: there is a lot of random movement there and a temptation to trade too often.
Do you need indicators to read a chart?
No. Indicators can be a useful filter, but first you should learn to read price itself: trend, levels, liquidity.
How do you tell a trend from a range?
In a trend, highs and lows keep updating in one direction. In a range, price moves between two boundaries and updates neither.
Where can I view charts for free?
Free charts with the main timeframes are available from exchanges, brokers and popular charting services. That is enough for learning.
More in the reference
Related questions
🎯 Find your trader type: What kind of trader are you? →
Trading on financial markets carries a risk of losing money. This material is educational and is not investment advice.
All beginner questions · Trading for beginners: where to start