Distribution
The same thing in reverse: price rose for a long time, went sideways, and there what was accumulated gets sold to those buying on emotion.
Distribution — what it is?
Distribution is selling off. Price rose for a long time, then stopped and settled into a sideways corridor. Inside it a large participant sells what he accumulated to those buying on emotion after a long rally.
The mechanics are the same as with accumulation, only inverted. You cannot sell it all at once — price would collapse. So you have to hold it up high and hand it out in parts while there are still buyers.
The same question helps here: what is in the interest of whoever is unloading a large position. He needs buyers, and there are most of them at the top, right after a high is poked through. That is where price gets led.
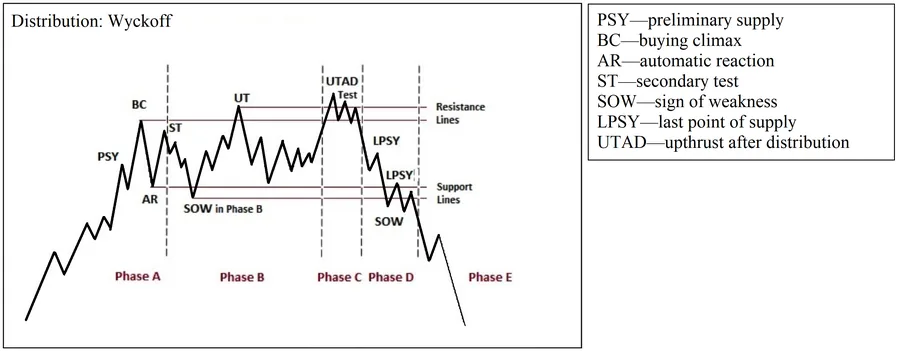
The same five phases, mirrored events. The diagram below reads exactly like the accumulation one, only upside down.
- PSY — Preliminary supply. The rally slowed for the first time: the first large sellers showed up.
- BC — Buying climax. A sharp push up at peak optimism — everyone is buying. This high becomes the upper boundary of the corridor.
- AR — Automatic reaction. Buyers have run out and price falls by itself. The low of that fall becomes the lower boundary.
- ST — Secondary test. Price comes back up to check whether any buyers are left.
- Phase B — The long distribution. Price walks inside the corridor and checks both boundaries several times.
- UT — An upthrust in phase B. A poke through the upper boundary with a return. It happens several times and decides nothing — do not confuse it with the UTAD.
- UTAD — The final poke in phase C. The same spike, but the last one: after it the structure is finished. This is where sellers' stops and the orders of those waiting for an upside break are collected — and that is the volume to exit into.
- Test — A second approach to the high, weaker than the last. There are no buyers left up there.
- LPSY — Last point of supply. A sluggish pullback up that does not reach the high. There can be several.
- SOW — Sign of weakness. Wide candles drop price below the lower boundary. The seller won.
- Phase E — The decline outside the corridor.
Distribution — how it is built?
You cannot tell accumulation from distribution by the picture of the corridor alone — they look identical. There is one difference: where price came from. After a rally it is distribution, after a fall it is accumulation. Look at that before anything else. After that the main thing is not to mix up a UT with a UTAD: there can be several spikes in phase B and they mean nothing, whereas the UTAD comes after a long phase B and closes out the structure. The confirmation is the first LPSY, a sluggish pullback up that does not reach the high of the poke. In Smart Money vocabulary the UTAD is called an upward poke or a deviation, and the sign of weakness, SOW, an impulse that breaks structure downward.
Distribution — common mistakes
Calling every upward poke a UTAD. There can be several such spikes in phase B, and they mean nothing.
Deciding the phase from the shape of the corridor instead of from the preceding move.
Buying the break of the upper boundary along with the crowd: most often that is the spike itself.
Selling right on the poke without waiting for the return and the shift in structure.
Placing the stop tight behind the high of the poke.
Missing the PSY. The first large seller appears before the buying climax.
Related to
Glossary
- long
- buying in expectation of a rise.
- accumulation
- the phase where a large participant builds a position inside a sideways range.
- high
- the highest price of the period.
- position
- an open trade.
- preliminary supply
- the first noticeable resistance at the top.
- buying climax
- a sharp rise at peak optimism.
Test yourself
Where is accumulation happening before a rise?
Correct. The app has tasks like this in every lesson — 119 lessons on real charts. Solve in the app →
Not this one. The right answer is the other chart. The app has tasks like this in every lesson — 119 lessons on real charts. Solve in the app →