The range
A corridor between two boundaries where price goes back and forth. The market spends most of its time in one.
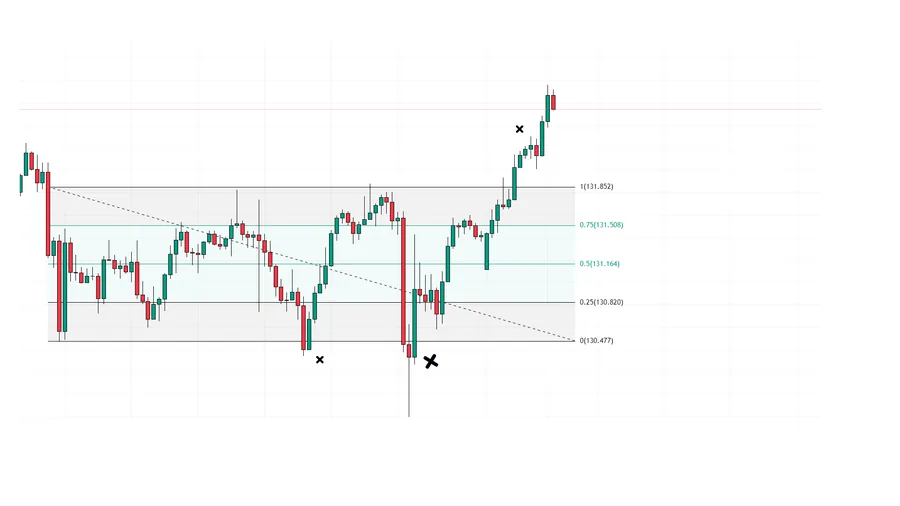
The range — what it is?
A range is the span between two boundaries inside which price moves with no clear direction. Classical analysis calls it a sideways market.
In Smart Money terms it is not a pause but a working phase: a large participant is building or offloading a position. Building one inside a trend is impossible — there is not enough opposing volume.
The crowd loses money in the meantime, trading from the boundaries inwards. Stops pile up beyond both boundaries, and sooner or later price comes for them.
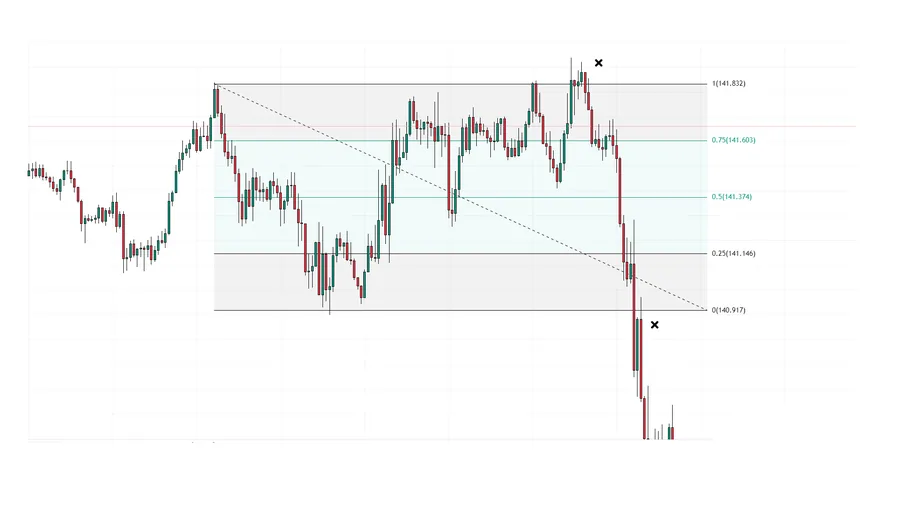
The range — how it is built?
The boundaries are drawn by the full range of the candles, then a quartile grid goes over the range. The middle is equilibrium, the upper half is premium, the lower half is discount. The best trades come not from inside the range but after a sweep beyond a boundary and a return.
The range — common mistakes
Trading inside the range from boundary to boundary without looking at context.
Calling a move beyond a boundary a breakout without a candle close.
Failing to distinguish a range after a rally from a range after a decline: those are different phases.
Drawing the boundaries off candle bodies.
Related to
Glossary
- range
- movement inside a horizontal corridor with no clear direction.
- position
- an open trade.
- trend
- a steady directional move in price.
- volume
- the number of trades or contracts in a period.
- candle
- the element of the chart that shows four prices for a period: open, high, low, close.
- equilibrium
- the middle of the range, the 0.5 level.
Test yourself
Where is the market standing in a range?
Correct. The app has tasks like this in every lesson — 119 lessons on real charts. Solve in the app →
Not this one. The right answer is the other chart. The app has tasks like this in every lesson — 119 lessons on real charts. Solve in the app →